Table of Contents >> Show >> Hide
If the stock market had a mood ring, the CAPE ratio would be one of the shinier stones in it. Investors love it, argue about it, misuse it, defend it, and occasionally wave it around like it is a crystal ball that knows exactly when the next market mess will arrive. It is not that. Still, the cyclically adjusted price-to-earnings ratio, better known as CAPE or the Shiller P/E, remains one of the most useful ways to think about how expensive or cheap the U.S. stock market looks over long stretches of time.
CAPE matters because it tries to answer a simple but stubborn question: Are investors paying too much for earnings? Instead of looking at just one year of profits, which can swing wildly during recessions, recoveries, booms, and accounting dramas, CAPE compares today’s market price to the average of the past 10 years of inflation-adjusted earnings. In plain English, it smooths out the business cycle so investors do not mistake a sugar rush for permanent muscle.
That smoothing is exactly why CAPE has become a favorite tool for discussing long-term market valuation, historical stock returns, mean reversion, and future real returns. But here is the catch: CAPE can say a lot about long-run odds and very little about next Tuesday. It is better at setting expectations than ringing a closing bell on bubbles.
What Is the CAPE Ratio, Exactly?
The CAPE ratio is calculated by dividing the current level of a stock index, usually the S&P 500, by the average of the previous 10 years of earnings after adjusting those earnings for inflation. That makes it different from the standard P/E ratio, which uses current or forward earnings and can become distorted when profits temporarily soar or collapse.
The logic goes back to Benjamin Graham and David Dodd, who argued long ago that a multi-year earnings average gives a better picture of a company’s earning power than a single hot or ugly year. Robert Shiller and John Campbell modernized that idea and showed why long-run earnings data could help investors think more clearly about valuation and future outcomes. In other words, CAPE is not just a ratio; it is a reminder that markets have memories, even when traders act like they had three espressos and no sleep.
Why the 10-Year Average Matters
A one-year P/E can make the market look cheap right before profits roll over or absurdly expensive right after a recession crushes earnings. CAPE tries to reduce that whiplash. By averaging a decade of real earnings, it captures one or two business cycles and gives a more stable measure of normalized profitability.
That is why CAPE is most often used to estimate long-term expected returns, especially real returns over the next 10 years. It is not perfect, but it is usually more useful than pretending the latest earnings report defines the next decade.
Where CAPE Sits in Historical Context
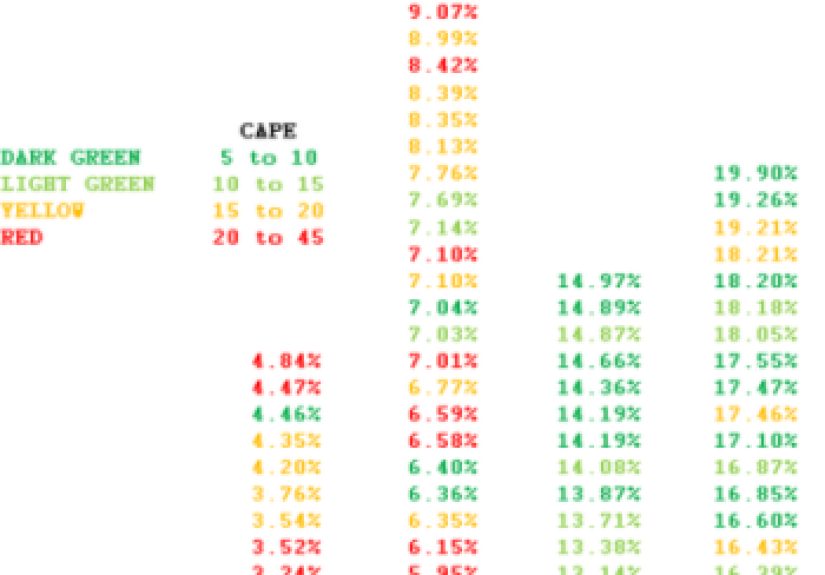
Over the full historical record, the U.S. market’s CAPE has averaged around 17. That does not mean 17 is some sacred universal truth carved into granite by the gods of valuation. It simply means the market has often spent long periods above and below that neighborhood. A CAPE in the low teens or single digits has historically been associated with fear, recession, or outright market despair. A CAPE above 25 has often signaled elevated optimism. A CAPE above 30 has usually meant investors were shopping in the premium aisle with very little shame.
The most famous extreme was the dot-com bubble, when CAPE reached its historic peak near 44 around the turn of 2000. Late 1929 and the run-up to the 2007 financial crisis were also major valuation extremes. By early 2026, CAPE remained in historically elevated territory, still roughly in the high-30s to around 40 depending on the data cut. That is a fancy way of saying the market has not exactly been shopping the clearance rack.
What Historical Outcomes Tell Us
The strongest case for CAPE is not that it predicts crashes. It does not. The strongest case is that it has been reasonably informative about the range of long-run historical outcomes. When starting CAPE has been very low, subsequent 10-year real returns have usually been strong. When starting CAPE has been very high, subsequent 10-year real returns have usually been weaker, and sometimes painfully so.
Notice the word “usually.” That word does a lot of work here.
Historically, periods with CAPE below 10 have often set the stage for excellent long-run returns. That makes sense. When investors are deeply pessimistic, valuations are compressed, and future returns do not need heroic assumptions to look attractive. In contrast, when CAPE has climbed above 30, the market has often delivered disappointing 10-year real returns. The reason is not mystical. When investors already pay a premium price for earnings, a lot of good news is already baked in. Future returns then depend on profits staying strong, rates staying cooperative, and investor enthusiasm refusing to take a nap.
High CAPE Does Not Mean an Immediate Crash
This is where many investors get CAPE wrong. A high CAPE does not say, “Sell everything and hide under the bed.” It says, “Your long-term return expectations should probably be lower from here.” The market can remain expensive for years. In fact, the late 1990s are the classic example. CAPE looked stretched well before the bubble finally burst. Anyone who treated it like a stopwatch instead of a warning light probably got steamrolled by momentum before being proven technically, emotionally, and financially correct.
Research and market commentary in recent years have also emphasized that some high-CAPE periods still produced decent or even strong 10-year outcomes when those periods did not end in a major crisis. That is an important nuance. CAPE influences the odds, but macro shocks, inflation, war, policy mistakes, and credit accidents can matter just as much, and sometimes more.
A Useful Range of Historical Outcomes by CAPE Level
While no threshold is magical, history suggests a broad framework:
When CAPE Is Low
Low CAPE readings have usually appeared during ugly moments: deep recessions, post-crash environments, or eras when investors wanted absolutely nothing to do with stocks. Those have often been the best setups for future long-term returns. Think of the early 1930s, the early 1980s, and the aftermath of the 2008–2009 crisis. Nobody rings a bell and says, “Congratulations, fear has peaked.” But historically, low CAPE environments have rewarded patience.
When CAPE Is Around Average
Mid-range CAPE readings have generally led to more ordinary outcomes. Investors are not getting a screaming bargain, but they are not paying fantasy prices either. This zone often produces decent long-run returns that depend more heavily on earnings growth, inflation, and interest rates than on valuation mean reversion alone.
When CAPE Is High
High CAPE readings compress future return potential. That does not mean negative returns are guaranteed. It means the margin for error gets thinner. Markets can still climb higher, sometimes for years, but the odds of a weak or frustrating decade increase. Historically, very high CAPE levels have often been followed by lower real returns, and in the most extreme cases, lost decades.
Why CAPE Is Helpful but Imperfect
CAPE’s critics are not wrong to point out its flaws. First, it is backward-looking. It uses past earnings, which means it can understate the market’s fair value when the economy has genuinely become more profitable, more innovative, or more asset-light. Second, accounting rules have changed over time, which makes apples-to-apples comparisons across many decades a little less clean than investors sometimes pretend.
Third, CAPE does not fully capture the impact of stock buybacks, which have become a major method of returning capital to shareholders. Fourth, the structure of the market has changed. The U.S. index used to be dominated by sectors like industrials, materials, and energy. Today, technology and communication services hold a much bigger share, and those sectors can support higher margins and, at times, higher valuations. Fifth, interest rates matter. A market with lower discount rates can justify a higher valuation than one competing with rich bond yields.
There is also a growing debate about whether CAPE’s mean-reverting behavior has changed since the early 1990s. Some analysts argue the relationship is weaker than it used to be, or at least noisier. That does not make CAPE useless. It just means investors should treat it as one powerful lens, not the whole eyeglasses store.
How Smart Investors Actually Use CAPE
The best use of CAPE is not market timing. It is expectation setting. If CAPE is very high, investors may want to assume lower future real returns, keep diversification honest, rebalance instead of panic, and avoid building plans that require the market to behave like a golden retriever after hearing the word “walk.”
CAPE can also help with relative valuation. For example, investors may compare U.S. valuations with foreign markets, value stocks with growth stocks, or broad equities with bonds. It can guide portfolio planning, spending expectations, and risk discipline. What it should not do is convince someone that one scary number alone can tell them the exact month a bubble will pop. The market has a long history of humiliating people who confuse “expensive” with “about to fall tomorrow.”
Investor Experiences Across Different CAPE Eras
The most revealing part of CAPE is not the formula. It is the human behavior wrapped around it. To understand that, it helps to think in terms of investor experiences drawn from real market eras.
Imagine an investor in late 1929. Stocks had already surged, optimism was abundant, and high valuation felt less like a warning and more like proof that a new age had arrived. In that kind of environment, CAPE looked stretched, but euphoria often drowns out sober analysis. The experience that followed was brutal. Valuation did not predict the exact day of the collapse, but it did reflect a market priced for perfection right before reality slammed the brakes.
Now picture a very different investor in the early 1980s. Inflation had damaged confidence, recessions had rattled households, and stocks were not fashionable dinner-party conversation. CAPE was low because fear was high and expectations were miserable. That investor’s experience was the opposite of the late-1929 buyer’s experience. Starting valuations were compressed, and long-term returns that followed were far stronger than most people expected in the moment.
Then came the late 1990s, the era that made CAPE famous outside academic circles. An investor who noticed the ratio climbing into the stratosphere was not crazy to worry. But that worry did not provide an easy trading plan. The market kept rising before the eventual dot-com unwind. This is one of the most important CAPE lessons of all: being early can feel exactly like being wrong. Investors who understood valuation but lacked patience or discipline could still get tossed around by a market that stayed irrational longer than their nerves could tolerate.
The 2009 experience offered another lesson. Investors who rebalanced into stocks after the financial crisis were not buying because headlines looked cheerful. They were buying because valuations had improved and fear had done what fear usually does: it made future returns look better for those willing to stay rational. CAPE did not remove risk, but it did improve the long-run setup.
Finally, consider the investor living through the early 2020s and into 2026. This investor sees a high CAPE, hears warnings of overvaluation, and also sees a market dominated by cash-rich technology businesses with stronger margins than the industrial giants of older decades. The experience is complicated. CAPE says returns may be more muted than in cheap eras. Modern market structure says the old average may not be the only fair benchmark. The real lesson is not to worship or dismiss CAPE. It is to use it humbly, as part of a broader historical map.
Conclusion
The CAPE ratio remains one of the best tools for understanding market valuation and the range of historical outcomes that tend to follow different starting prices. It works best over long horizons, especially when investors want to estimate how generous or stingy the next decade might be in real terms. Low CAPE has historically opened the door to stronger future returns. High CAPE has historically narrowed that door.
But CAPE is not a crash siren, a countdown clock, or a magic trick. It does not tell you exactly when expensive markets will stop getting more expensive. What it does do is force investors to lower their voice, step away from the hype, and remember that price still matters. In a market world full of hot takes and cooler heads, that is a pretty valuable service.