Table of Contents >> Show >> Hide
- What “30 Years of Returns” Really Means (and What It Doesn’t)
- The 30-Year Scoreboard: Stocks, Bonds, Cash, Inflation
- Why the “Average Return” Is a Terrible Bedtime Story
- The Hidden Villain: Timing (a.k.a. The Investor Return Gap)
- Time in the Market Beats Timing the Market (Yes, Even When It’s Boring)
- Asset Allocation: Your Return Is a Recipe, Not a Single Ingredient
- A Practical 30-Year Playbook (No Crystal Ball Required)
- Conclusion: The Point Isn’t PredictingIt’s Surviving Long Enough to Compound
- Investor Experiences From a 30-Year Window (Extra Insights)
If you want to feel equal parts confident and humbled, study 30 years of financial market returns.
You’ll see why long-term investing works… and why it still manages to feel like riding a roller coaster while reading a spreadsheet.
The numbers are soothing. The path to those numbers is not.
Inspired by the “zoom-out” approach popularized by A Wealth of Common Sense, this article walks through what
three decades of stock market returns, bond market returns, cash returns,
and inflation can teach youwithout pretending the market is a polite, predictable machine.
(It is not. It’s more like a toddler with a sugar rush and a Bloomberg terminal.)
What “30 Years of Returns” Really Means (and What It Doesn’t)
A 30-year window is long enough to include multiple recessions, booms, bubbles, crashes, recoveries, policy pivots,
and at least one era where your aunt’s hairdresser had “a sure thing” tech stock tip.
It’s also long enough to show a powerful truth: compounding rewards patience far more reliably than
prediction rewards genius.
But “30 years of returns” does not mean you get the average return every year like clockwork.
It means you get a messy sequence of annual resultssome great, some ugly, some “why do I even have a brokerage account?”
And then, if you stick around long enough, you may end up with a long-term average that looks impressively calm.
For context, the 30-year period often cited in discussions like this one (ending in 2023) includes:
a late-1990s melt-up, the dot-com bust, the 2008 global financial crisis, a long post-crisis expansion,
the 2020 pandemic shock, and the inflation/rate-reset era that bruised both stocks and bonds.
That’s not a “special” 30 years. That’s just… markets being markets.
The 30-Year Scoreboard: Stocks, Bonds, Cash, Inflation
Over long stretches, markets tend to reward taking riskespecially equity risk.
But the details matter, because the experience of earning those returns is where most people get knocked off course.
A quick, high-level snapshot (illustrative long-term averages)
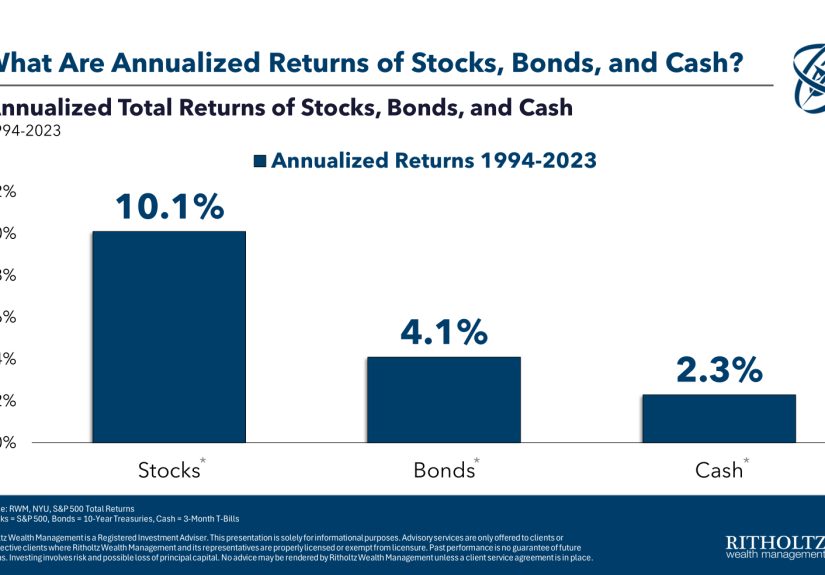
One widely shared 30-year breakdown (covering the 30 years ending in 2023) shows approximate annualized averages like:
| Asset / Measure | What it represents | Approx. annualized result (30-year window) |
|---|---|---|
| U.S. Stocks (S&P 500 total return) | Price + dividends (the full meal, not just the garnish) | ~10%–11% per year |
| 10-Year U.S. Treasuries | Government bonds with interest-rate sensitivity | ~4%–5% per year |
| Cash (3-month T-bills) | Short-term “sleep at night” money | ~2%–3% per year |
| Inflation (CPI-style measure) | The silent fee you pay for existing in the real world | ~2%–3% per year |
If you’ve ever wondered why long-term investors obsess over “real returns” (returns after inflation),
it’s because inflation doesn’t need to “crash” to do damage. It just needs to show up, year after year,
quietly shaving purchasing power like a tiny tax you never voted for.
The part people forget: how those averages are earned
- Stocks weren’t positive every year. But they were positive in most yearssomething like “more often than not” on steroids.
The long-term reward comes from enduring the minority of years that feel like punishment. - Bonds helped… until they didn’t. For much of modern history, high-quality bonds provided ballast when stocks fell.
But rising rates can be brutal for bond prices, and some periods remind you that “safer” doesn’t mean “never down.” - Cash rarely wins long races. It can win short sprints (especially when rates are high),
but it typically struggles to beat inflation and almost always struggles to beat stocks over decades.
Why the “Average Return” Is a Terrible Bedtime Story
The average market return is like the “average” temperature in a city where half the year is summer and half the year is winter.
Technically accurate, emotionally useless.
Over a 30-year span, you can have:
- multiple years with double-digit losses,
- years with outsized gains that make you question why you ever panicked,
- and stretches where the market goes sideways just long enough to annoy everyone equally.
That’s why rolling returns matter. A single calendar year can be wild, but a 10-, 20-, or 30-year
holding period often tells a different storyespecially for diversified portfolios.
Long horizons don’t remove volatility; they give you time to recover from it.
The Hidden Villain: Timing (a.k.a. The Investor Return Gap)
Here’s a frustrating, very human pattern:
investors often earn less than the funds or markets they invest innot because of fees alone,
but because of behavior.
This is sometimes called the investor return gap (or behavior gap):
the difference between a fund’s published return and the return investors actually experience after
imperfect decisions about when to buy, sell, or switch strategies.
Why does this gap happen?
- Performance chasing: buying what recently went up (often after much of the move is over).
- Panic selling: dumping risk after losses (often near the worst possible emotional moment).
- Overtrading: mistaking activity for progress.
- “This time is different” syndrome: it’s never different enough to stop being expensive.
Research groups have documented versions of this gap for years. For example, long-run estimates often show that
staying more consistentkeeping allocations steadier and rebalancing instead of reactingcan materially improve outcomes.
The dollar impact sounds abstract until you realize that “a percentage point or two” compounded over decades
is the difference between “retire comfortably” and “work forever out of spite.”
Time in the Market Beats Timing the Market (Yes, Even When It’s Boring)
One of the most repeated findings in personal finance is also one of the least followed:
the biggest market gains often cluster around the worst market moments.
That’s why market timing is so hard. If you sell after losses, you risk missing the reboundoften because the rebound
shows up when confidence is lowest and headlines are loudest.
The “missing the best days” trap
Multiple firms have illustrated some version of the same point: missing just a handful of the market’s best days can
dramatically reduce long-term results. The specific numbers vary by study and time period, but the takeaway is consistent:
the cost of being out of the market at the wrong time can be enormous.
The cruel twist: many of the “best days” happen during bear markets or early recoveriesexactly when many investors
are least likely to be fully invested.
Asset Allocation: Your Return Is a Recipe, Not a Single Ingredient
If 30 years teaches anything, it’s that your asset allocation does most of the heavy lifting.
Not your hot takes. Not your gut feelings. Not your group chat.
Diversification isn’t exciting. That’s the point.
A diversified portfolio blends assets that behave differentlystocks for growth, bonds for stability and income,
and cash for liquidity and near-term needs. Diversification won’t guarantee a profit or prevent losses,
but it can reduce the chance that one bad event wrecks your entire plan.
Rebalancing: the most awkward form of discipline
Rebalancing means trimming what grew and adding to what lagged to keep your target mix.
In plain English: it forces you to “sell a little high and buy a little low,” even when your emotions
would rather do the opposite.
It’s not magic. It’s maintenancelike brushing your teeth, but for your portfolio.
Boring, repetitive, and surprisingly effective if you do it consistently.
A Practical 30-Year Playbook (No Crystal Ball Required)
Here’s what tends to work for long-term investors who want a strategy that survives reality:
1) Match your portfolio to your timeline
Money needed soon shouldn’t be forced to ride out stock volatility. Cash and short-term bonds exist for a reason.
Money for decades in the future can often tolerate more stock exposurebecause it has time to recover.
2) Automate contributions
Regular investing (like through a workplace plan or recurring transfers) reduces the pressure to time entries.
It turns “Should I invest now?” into “I invest because it’s Tuesday.”
3) Keep costs and complexity under control
Fees, taxes, and unnecessary trading can quietly erode returns. A simple, low-cost approach is often harder to
brag aboutbut easier to stick with.
4) Rebalance on a schedule (or with bands)
Pick a method you can follow: annually, semi-annually, or when allocations drift beyond a set range.
The best system is the one you’ll actually use when markets get weird.
5) Have an “in case I panic” plan
Decide in advance what you’ll do during a major drawdown: review your allocation, check liquidity needs,
rebalance if appropriate, and avoid making irreversible decisions in the middle of a headline storm.
Friendly reminder: This is general educational information, not personalized financial advice.
Your goals, taxes, and risk tolerance matter.
Conclusion: The Point Isn’t PredictingIt’s Surviving Long Enough to Compound
The most useful lesson from 30 years of financial market returns isn’t “stocks return about X%.”
It’s that markets reward disciplineand discipline mostly looks like not doing something dramatic.
Over three decades, you’ll almost certainly face moments that feel like the end of the world (for your portfolio),
and moments that feel like free money (also dangerous).
The investors who do best aren’t the ones who predict every twist. They’re the ones who keep showing up,
keep a sensible asset allocation, and let compounding do its slow, unfairly powerful work.
Investor Experiences From a 30-Year Window (Extra Insights)
If you talk to long-term investorspeople who’ve actually lived through a few cyclesyou’ll notice a pattern:
their “experience” is less about picking winning assets and more about learning how to stay functional while markets
try to mess with their emotions. Over 30 years, most investors collect a handful of repeating memories that shape
how they behave (sometimes for the better, sometimes not).
One common experience is the first real bear market. It’s the moment you learn the difference between
“I understand volatility in theory” and “I just watched my account drop and my stomach dropped with it.”
Many investors describe a mental tug-of-war: the rational side says, “This is why stocks have higher long-term returns,”
while the emotional side says, “This feels like setting money on fire.” The investors who later succeed often point to
a simple decision they made during that period: they either stopped checking constantly, automated contributions,
or committed to a rebalancing rule so they wouldn’t have to negotiate with themselves every day.
Another repeated experience is realizing that good returns don’t feel good while they’re being earned.
Some of the strongest rebounds arrive when news is bleak and confidence is gone. Investors who stayed invested
often look back and say, “I didn’t feel braveI felt nauseous, but I didn’t sell.” That’s an underrated skill:
being able to keep your plan intact while your emotions try to rewrite it.
Many investors also recall the moment they discovered cash has a job. Early on, people tend to see cash
as “wasted potential,” especially during bull markets. But after living through a market dropespecially one that
coincides with job uncertainty or unexpected expensesinvestors learn that an emergency fund isn’t an investment,
it’s insurance. It prevents you from being forced to sell long-term holdings at the worst possible time.
Over decades, that kind of “boring protection” can be the difference between staying the course and blowing up the plan.
Then there’s the experience of watching friends chase performance. In every cycle, some asset becomes
the star of the moment. Investors who’ve been around for a while tend to describe the same movie with different actors:
a hot sector, a trendy strategy, a “can’t lose” idea. The most painful part isn’t that people get excitedit’s that
excitement often peaks near the end of a run, when risk is highest and future returns may be lower. Over 30 years,
many investors learn to treat hype like a weather report: interesting, sometimes useful, but not a reason to rebuild
your house every time the forecast changes.
Finally, long-term investors often talk about simplicity as a superpower. After trying more complicated
approachestoo many funds, too many trades, too many opinionsmany eventually come back to basics: diversified exposure,
reasonable costs, a clear asset allocation, and a rebalancing habit. It’s not that complexity never works; it’s that
complexity is harder to stick with when markets get chaotic. Over three decades, sticking with a good plan usually
beats frequently switching to a “perfect” plan you can’t maintain.
Put differently: a 30-year investing journey is a long series of small decisions. And the most important ones often
happen when you feel least like making themduring drawdowns, uncertainty, and the moments when your brain insists
that doing nothing is irresponsible. Sometimes, doing nothing is exactly what your plan requires.